Computer Details
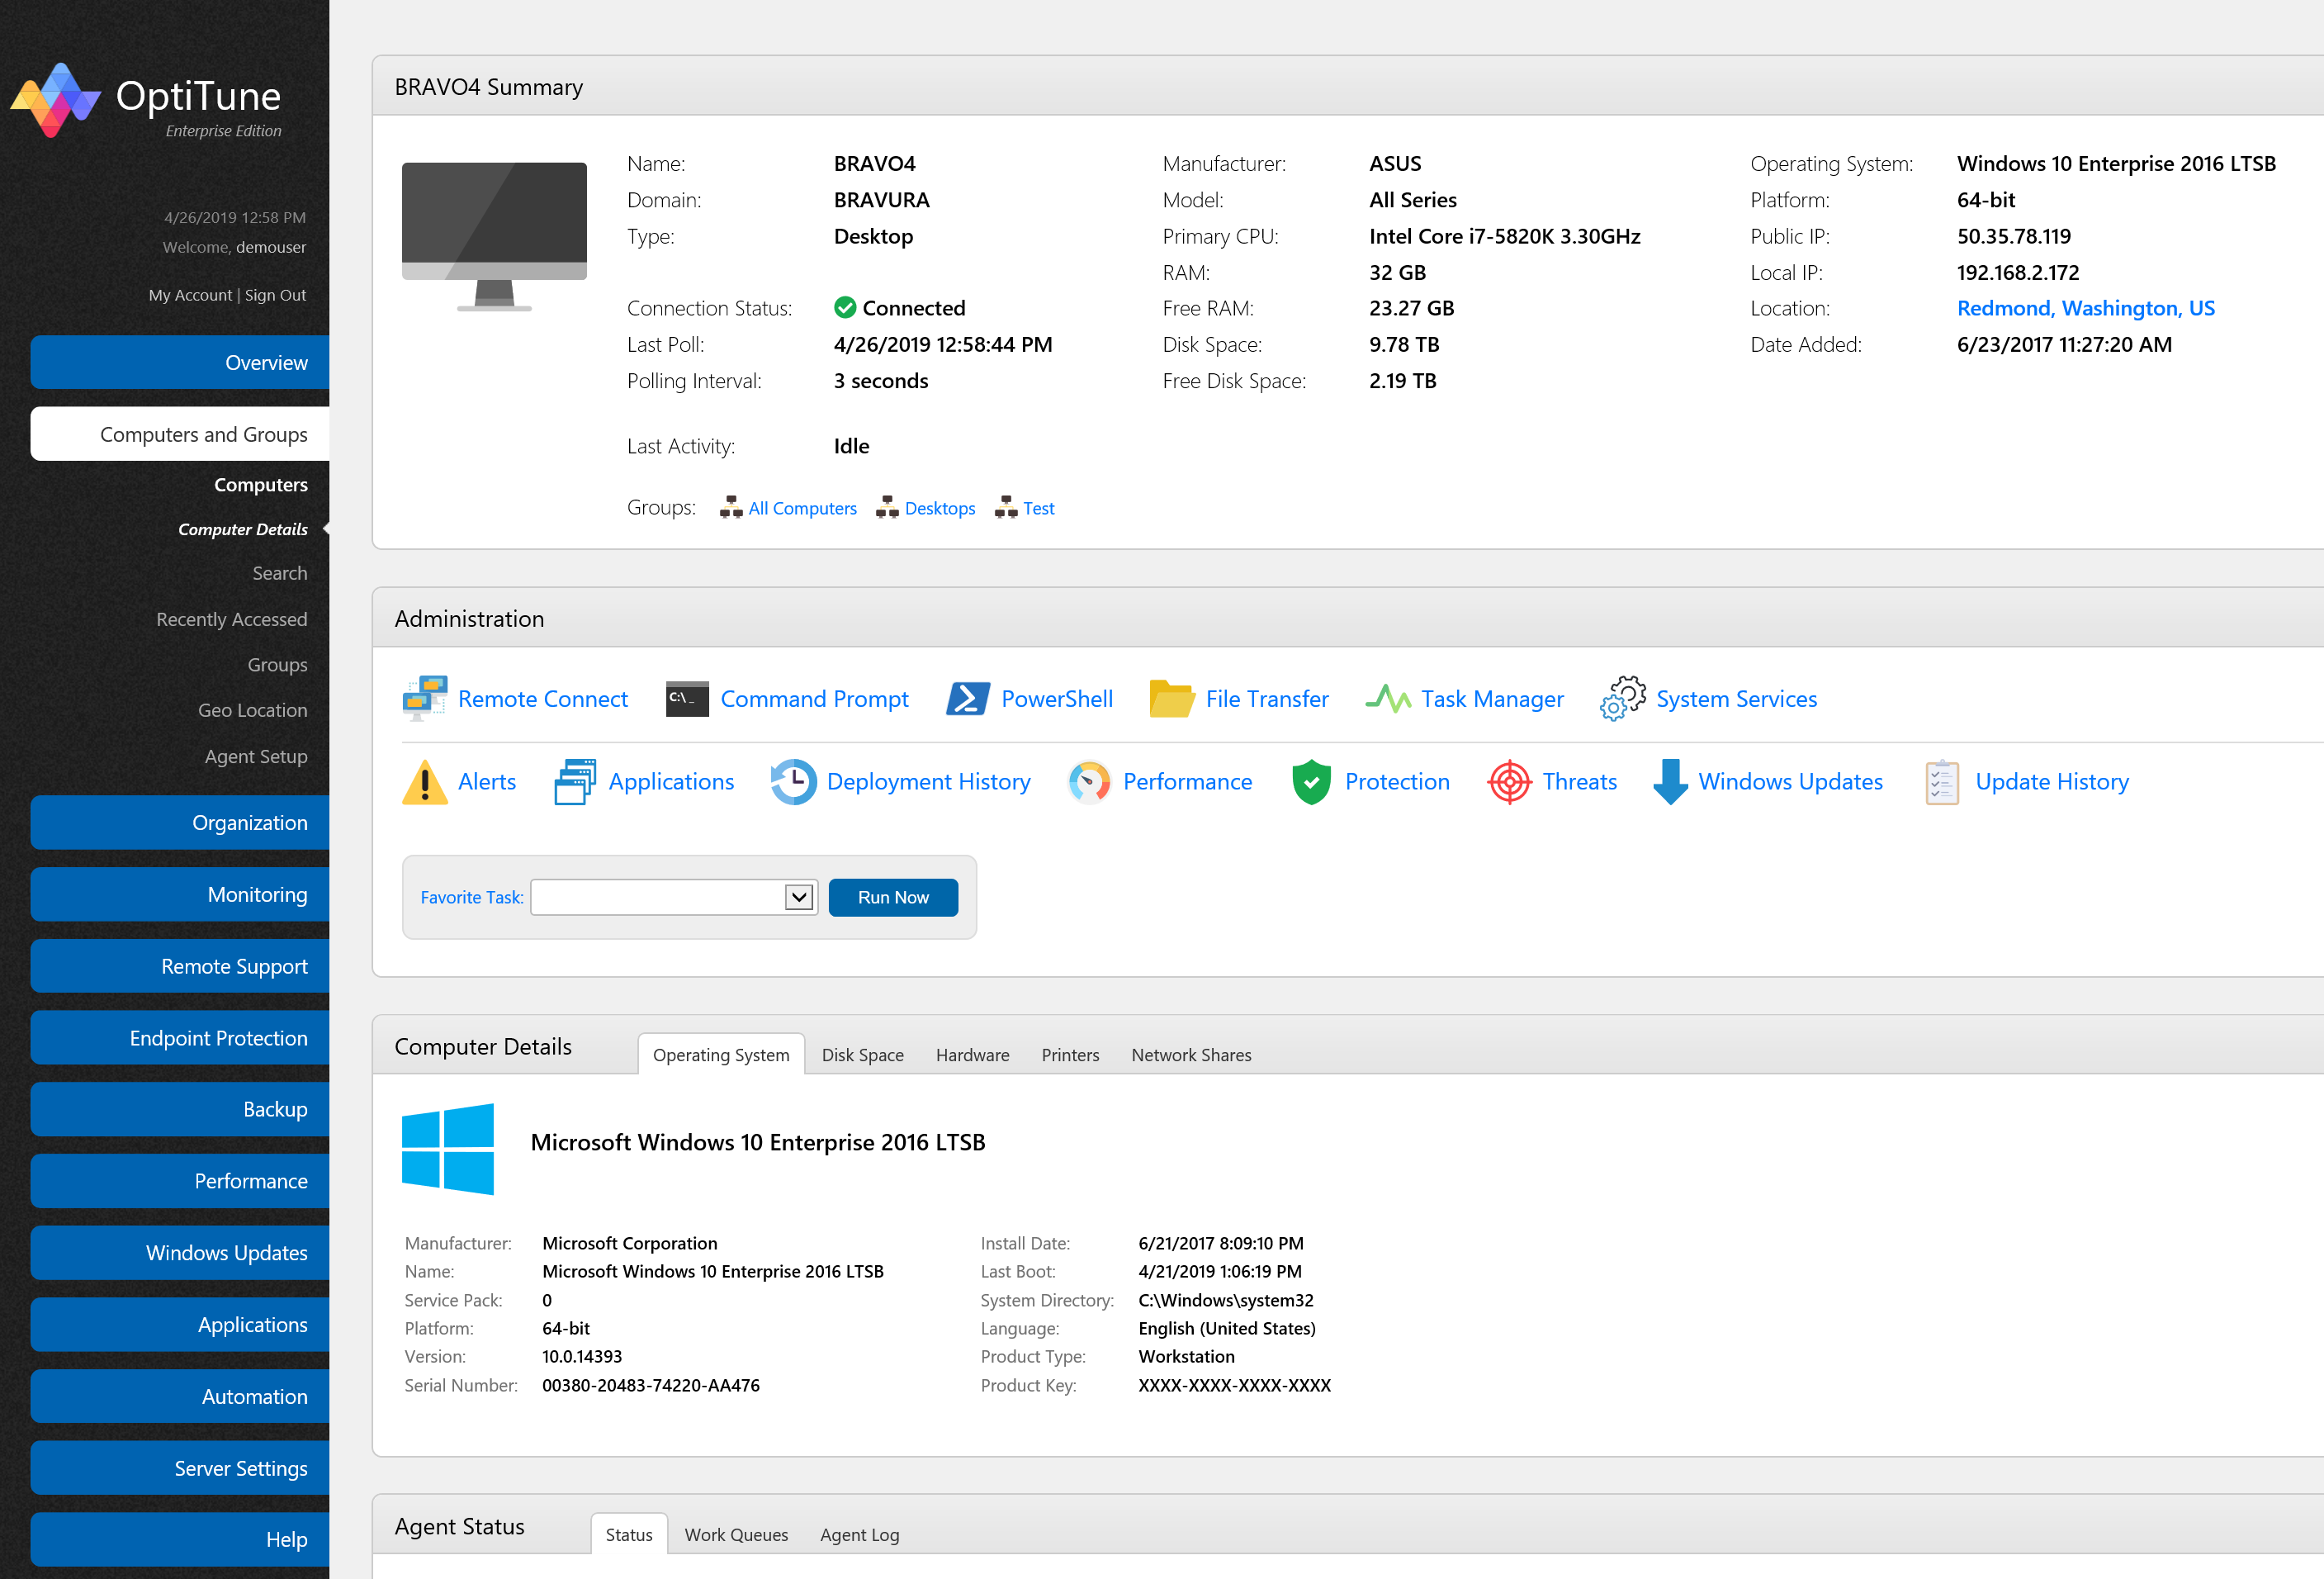
To view the details of a particular computer, click on the "Computers and Groups" tab, then select "Computers". Click on the name of the computer whose details you wish to view. You will see a page similar to the following:

On this screen, you will find many details about the computer. You can click on any of the links in the "Administration" section to view more information about the computer, such as Alerts, Applications, Deployment History, Performance, Protection, and Windows Updates, or to execute specific remote tools on the computer, such as Remote Connect, Command Prompt, Task Manager, and System Services.
Administration
Tools
This section includes the following remote administration tools:
- Remote Connect - remotely connect to a computer and control its desktop using your keyboard and mouse
- Command Prompt - remotely execute a command prompt
- PowerShell - remotely execute a powershell
- File Transfer - transfer files between your computer, and the remote computer, or vice versa
- Task Manager - view realtime performance information on the computer, and view or stop any running process
- System Services - view and control all system services on the computer
Information
You can also view detailed specific to the computer by clicking on any of these links:
- Alerts - view any alerts for the computer
- Applications - view the installed applications on the computer
- Deployment History - view the history for all active deployments on the computer
- Performance - view historical performance information about the computer (not realtime)
- Protection - view malware protection and status
- Threats - view any detected malware threats on the computer
- Windows Updates - view any windows updates that are available or installed on the computer
- Update History - view the complete history of installing updates on the computer
Computer Details
Operating System
Here you will find details about the operating system installed, as well as when it was installed and the version and edition of the operating system.
Disk Space
This section shows a graphical view of each logical disk on the system, showing the used and free space of each disk volume (e.g. C:, D:, etc...).
Hardware
This section lists hardware specific details about the computer, including:
Processor
Motherboard
BIOS
Memory
Hard Drives
Network Adapters
Sound Devices
Video Cards
Portable Batteries
Printers
This section shows all printers that are installed on the computer.
Network Shares
In this section, you will find all network shares that the computer has available to other computers.
Agent Status
This section shows realtime agent status information. When an agent is connected to OptiTune, it will automatically send status information at predetermined intervals.
Status
This tab shows realtime agent status information.

The following agent status information is displayed:
Connection Status
Connected - The agent is connected
Not Connected - The agent is not connected
Error - The web browser lost the connection with the management server
Unknown - The agent's connection status is unknown, since the management server recently started
Last Poll - When did the agent last check for its configuration?
Polling Interval - How frequently is the agent set to poll for its configuration?
Last Activity - A detailed description of what the agent last worked on. It can be any of the following:
Idle - The agent is not actively working on anything
Agent Started - The agent finished starting up, likely when the computer booted up
Agent Stopped - The agent stopped
System Shutting Down - The computer shut down
System Sleeping - The computer went to sleep
System Resumed from Sleep - The computer resumed from sleep
Running Task 'XYZ' (2 of 10) - The agent is currently running a task named 'XYZ', which is number 2 out of a total of 10 tasks queued to run.
Disconnected - The agent is no longer connected
Last Activity Time - When did the last activity occur?
Work Queues
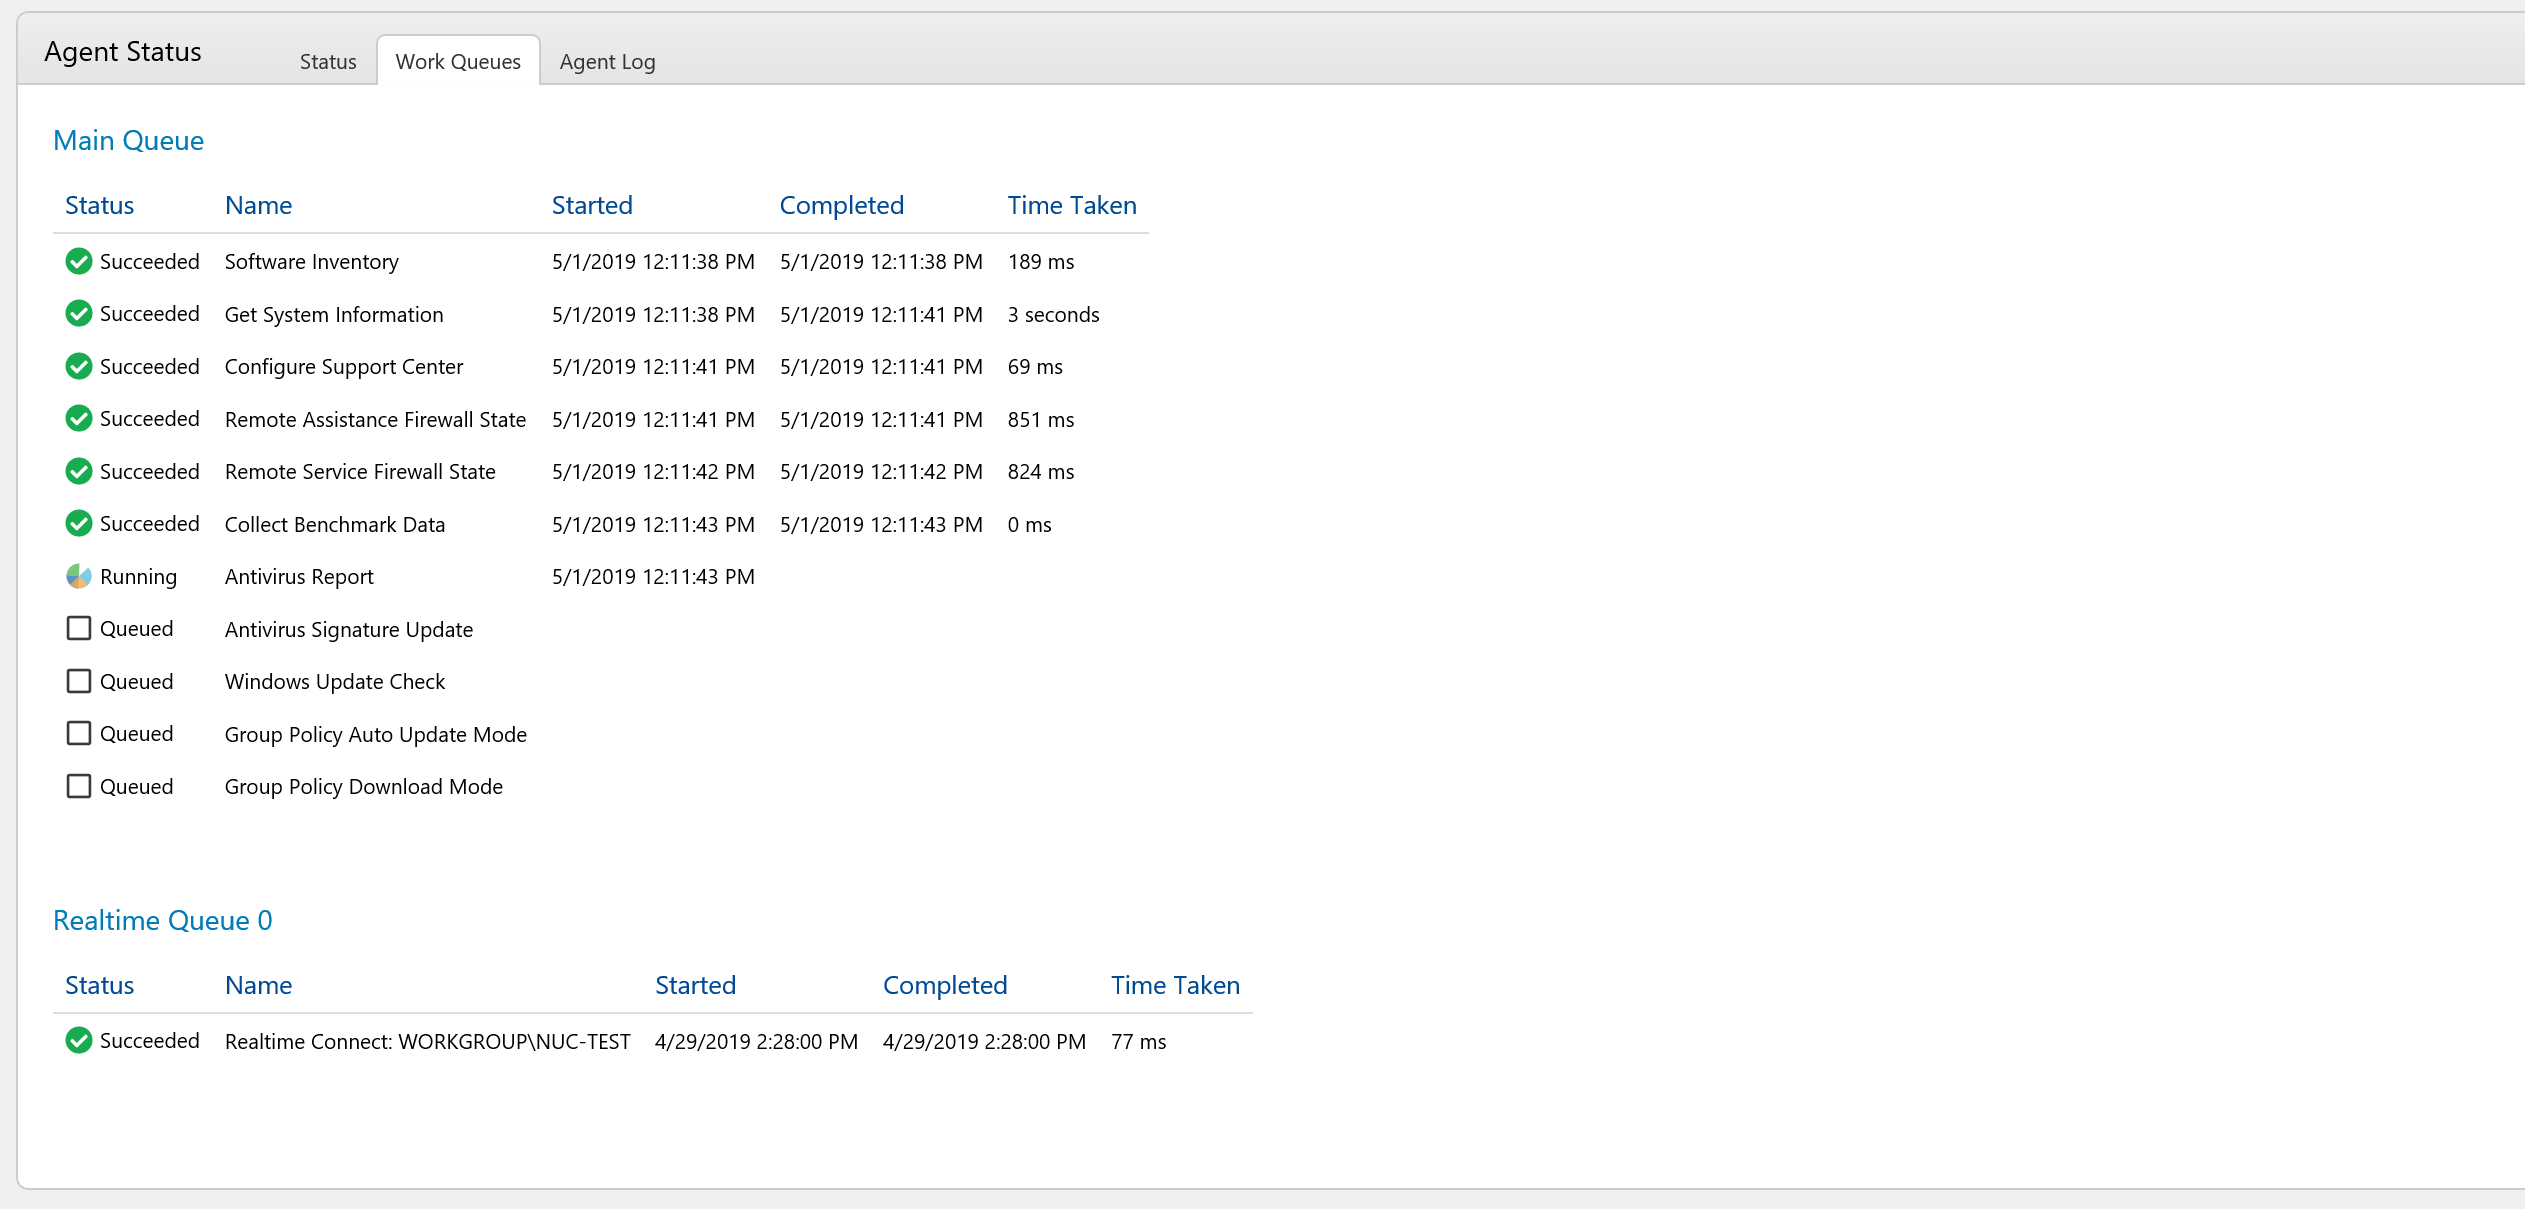
This tab shows all work queues that the agent is currently executing.

The OptiTune agent divides its work into multiple queues. Here, you can see in realtime exactly what the OptiTune agent is working on at a low level. Most work items will be executed in the "Main Queue", such as installing applications, checking for windows updates, or getting system information. If a task has not completed that you recently deployed, take a look here first to see if it is queued after other tasks.
Other time critical tasks, such as using Remote Connect, or the Command Prompt are executed in the Realtime Queues. There are up to 4 realtime queues available for the OptiTune agent to use when executing time critical tasks. Script tasks are also executed in the Realtime Queues, as well as system tasks, like restarting or shutting down a computer.
So, for example if you deploy 20 different script tasks to a computer, they won't all be executed in parallel, but rather in 4 realtime queues.
Agent Log
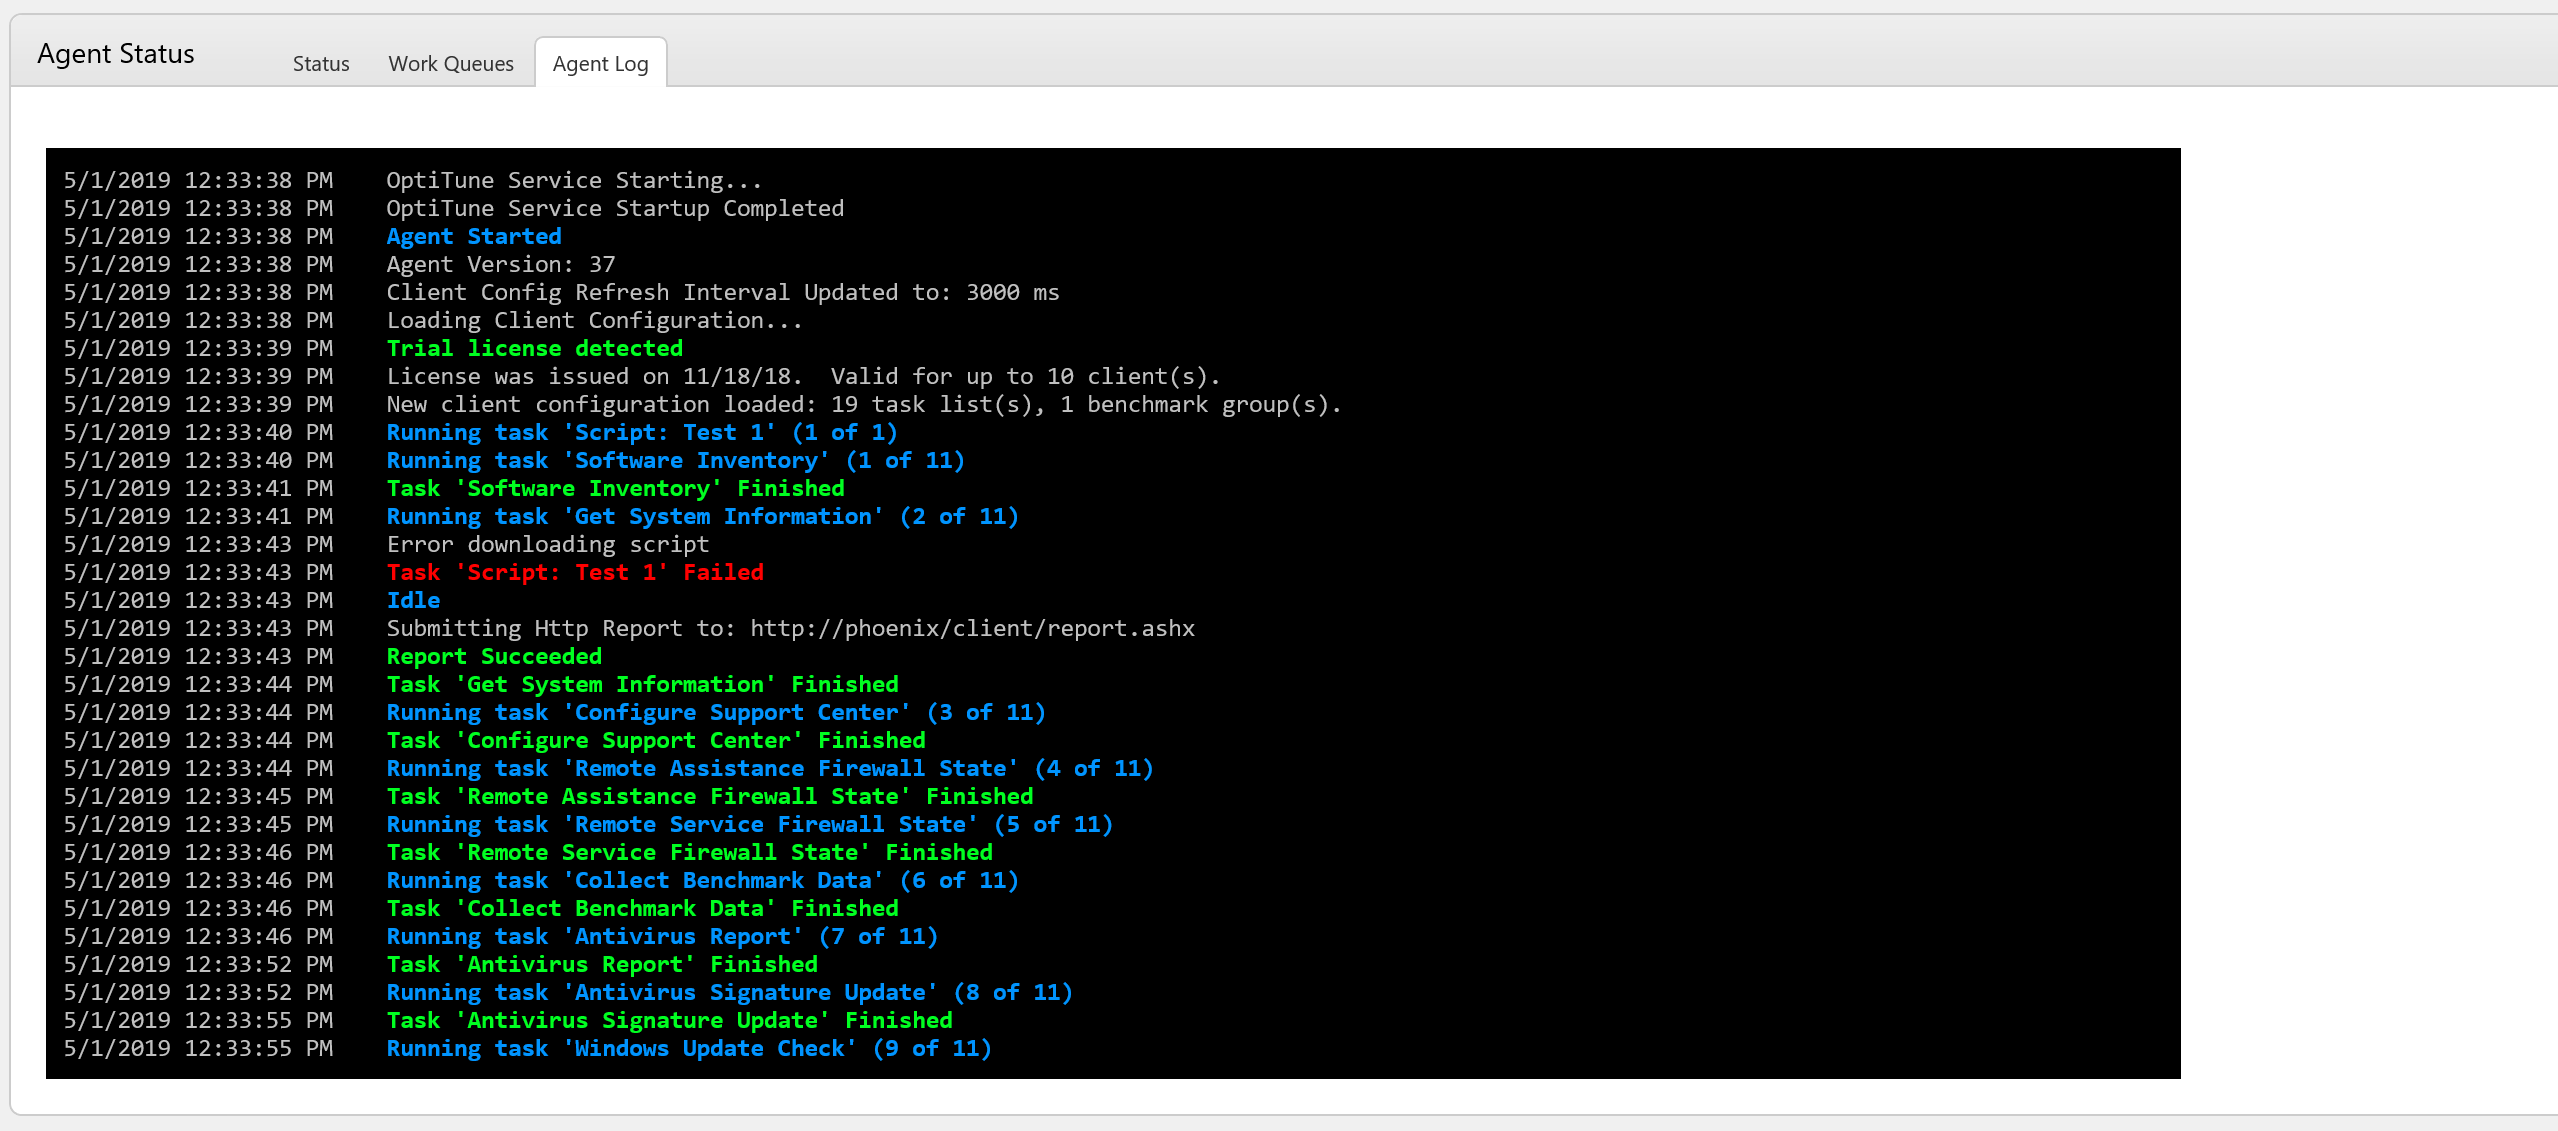
This tab shows the diagnostic log from the OptiTune agent. It is updated in realtime. This diagnostic log is useful to see a history of what the OptiTune agent has worked on over the last few days.

Maintenance
Metadata

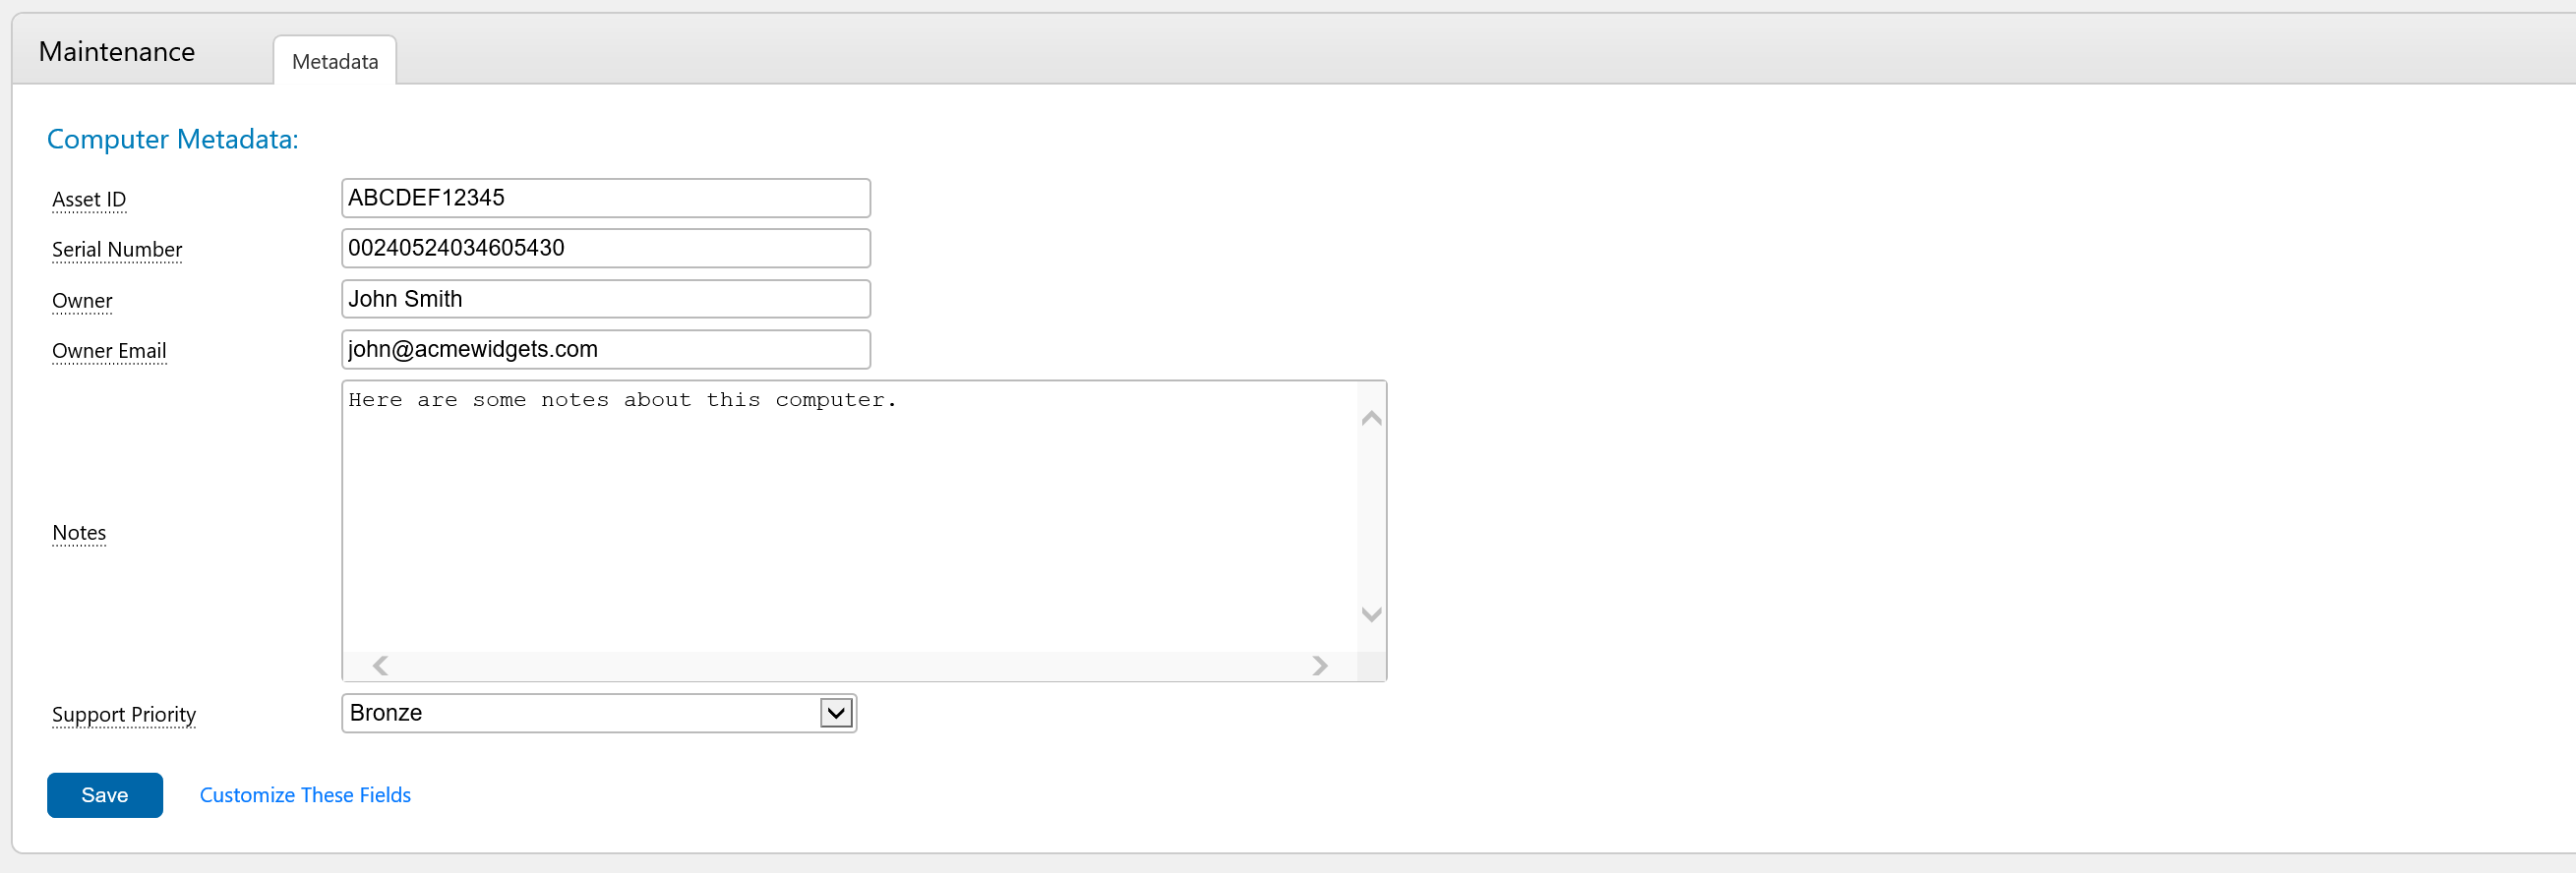
OptiTune also lets you store "meta data" (data about data) for each computer. This is a catch all area to store custom data that OptiTune doesn't necessarily support itself. You can even customize these meta data fields for your own organization.