Performance Overview
To view the performance overview, click on the "Performance" tab, then select "Overview".
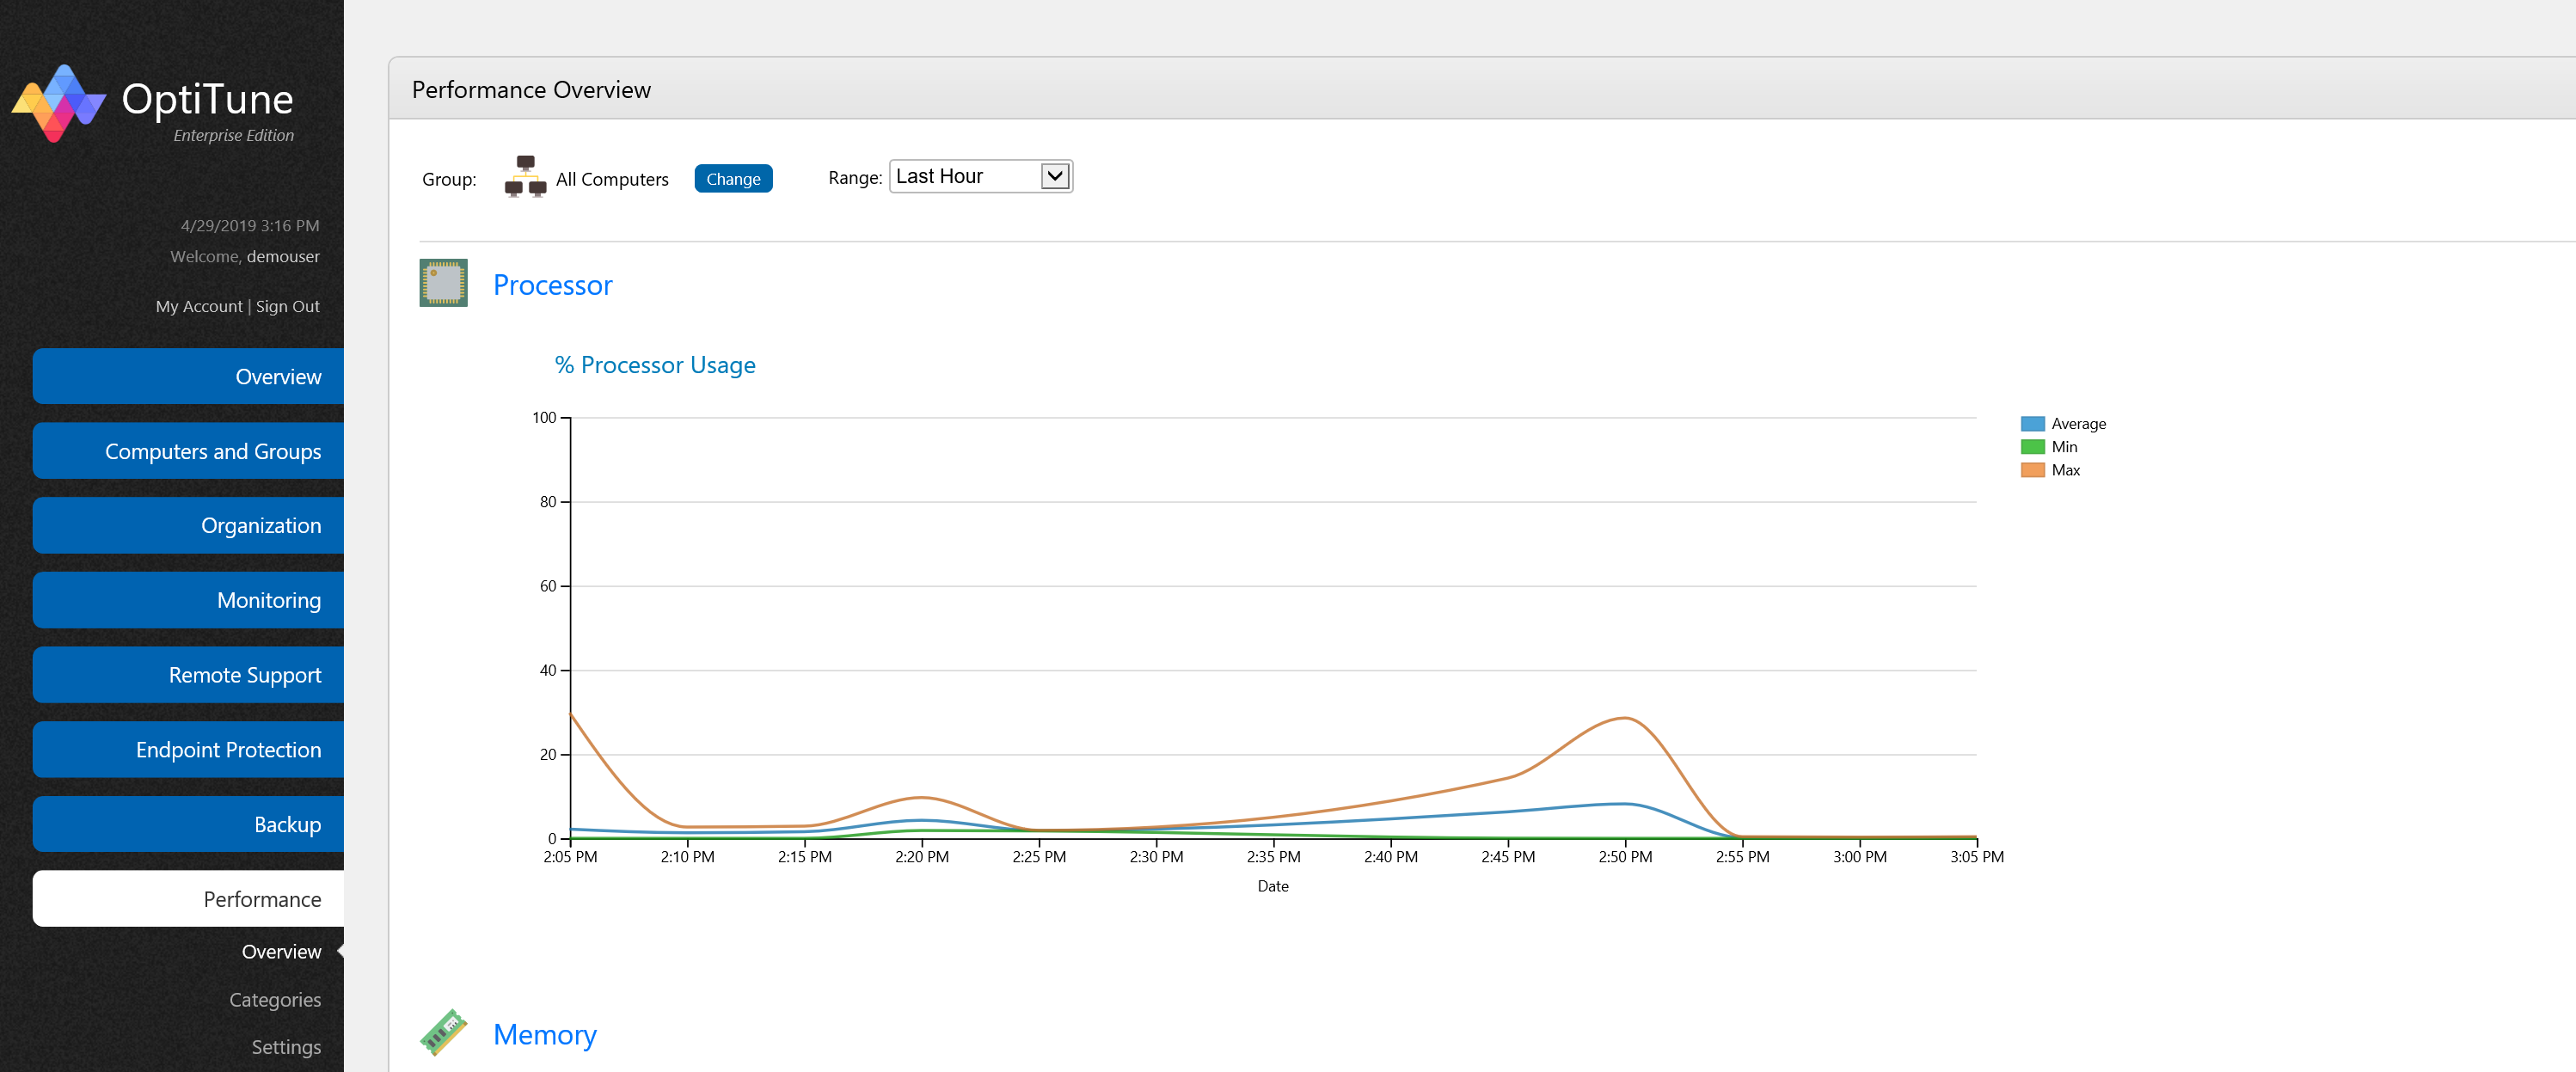
On this screen, you will find a series of graphs, each showing data for a particular performance area.
Viewing Groups vs. Individual Computers
When viewing performance data, you can choose to view aggregate data for an entire group, or data for an individual computer. You will notice that when viewing performance data for a group, there will be 3 lines:
Max - The maximum value for the group of computers
Average - The average value for the group of computers
Min - The minimum value for the group of computers
When viewing data for an individual computer, there will be just one line, which is the performance measurement for the computer. You can select which computer or group to view by clicking on the "Change" button at the top left corner of the screen.
Viewing a category
To view more details on a specific category, you can click on the text next to its icon. The categories available on the overview page include:
Processor - Metrics on the processor (CPU) on a computer
Memory - Metrics on the memory (RAM) on a computer
Disk - Metrics on the physical disk
Network - Metrics on the network interfaces of a computer
Other - Operating system specific metrics, such as the number of processes active, and system uptime.
Changing the date/time range
For any performance graph, you can adjust the date range shown by choosing from an option on the "Range" drop down list. Options include:
Today
Yesterday
Last 1 Minute
Last 5 Minutes
Last 15 Minutes
Last 30 Minutes
Last Hour
Last 4 Hours
Last 8 Hours
Last 7 Days
Last 14 Days
Last 30 Days
Custom - specify an arbitrary date/time range