OptiTune Overview
To view the main overview, click on the "Overview" tab.
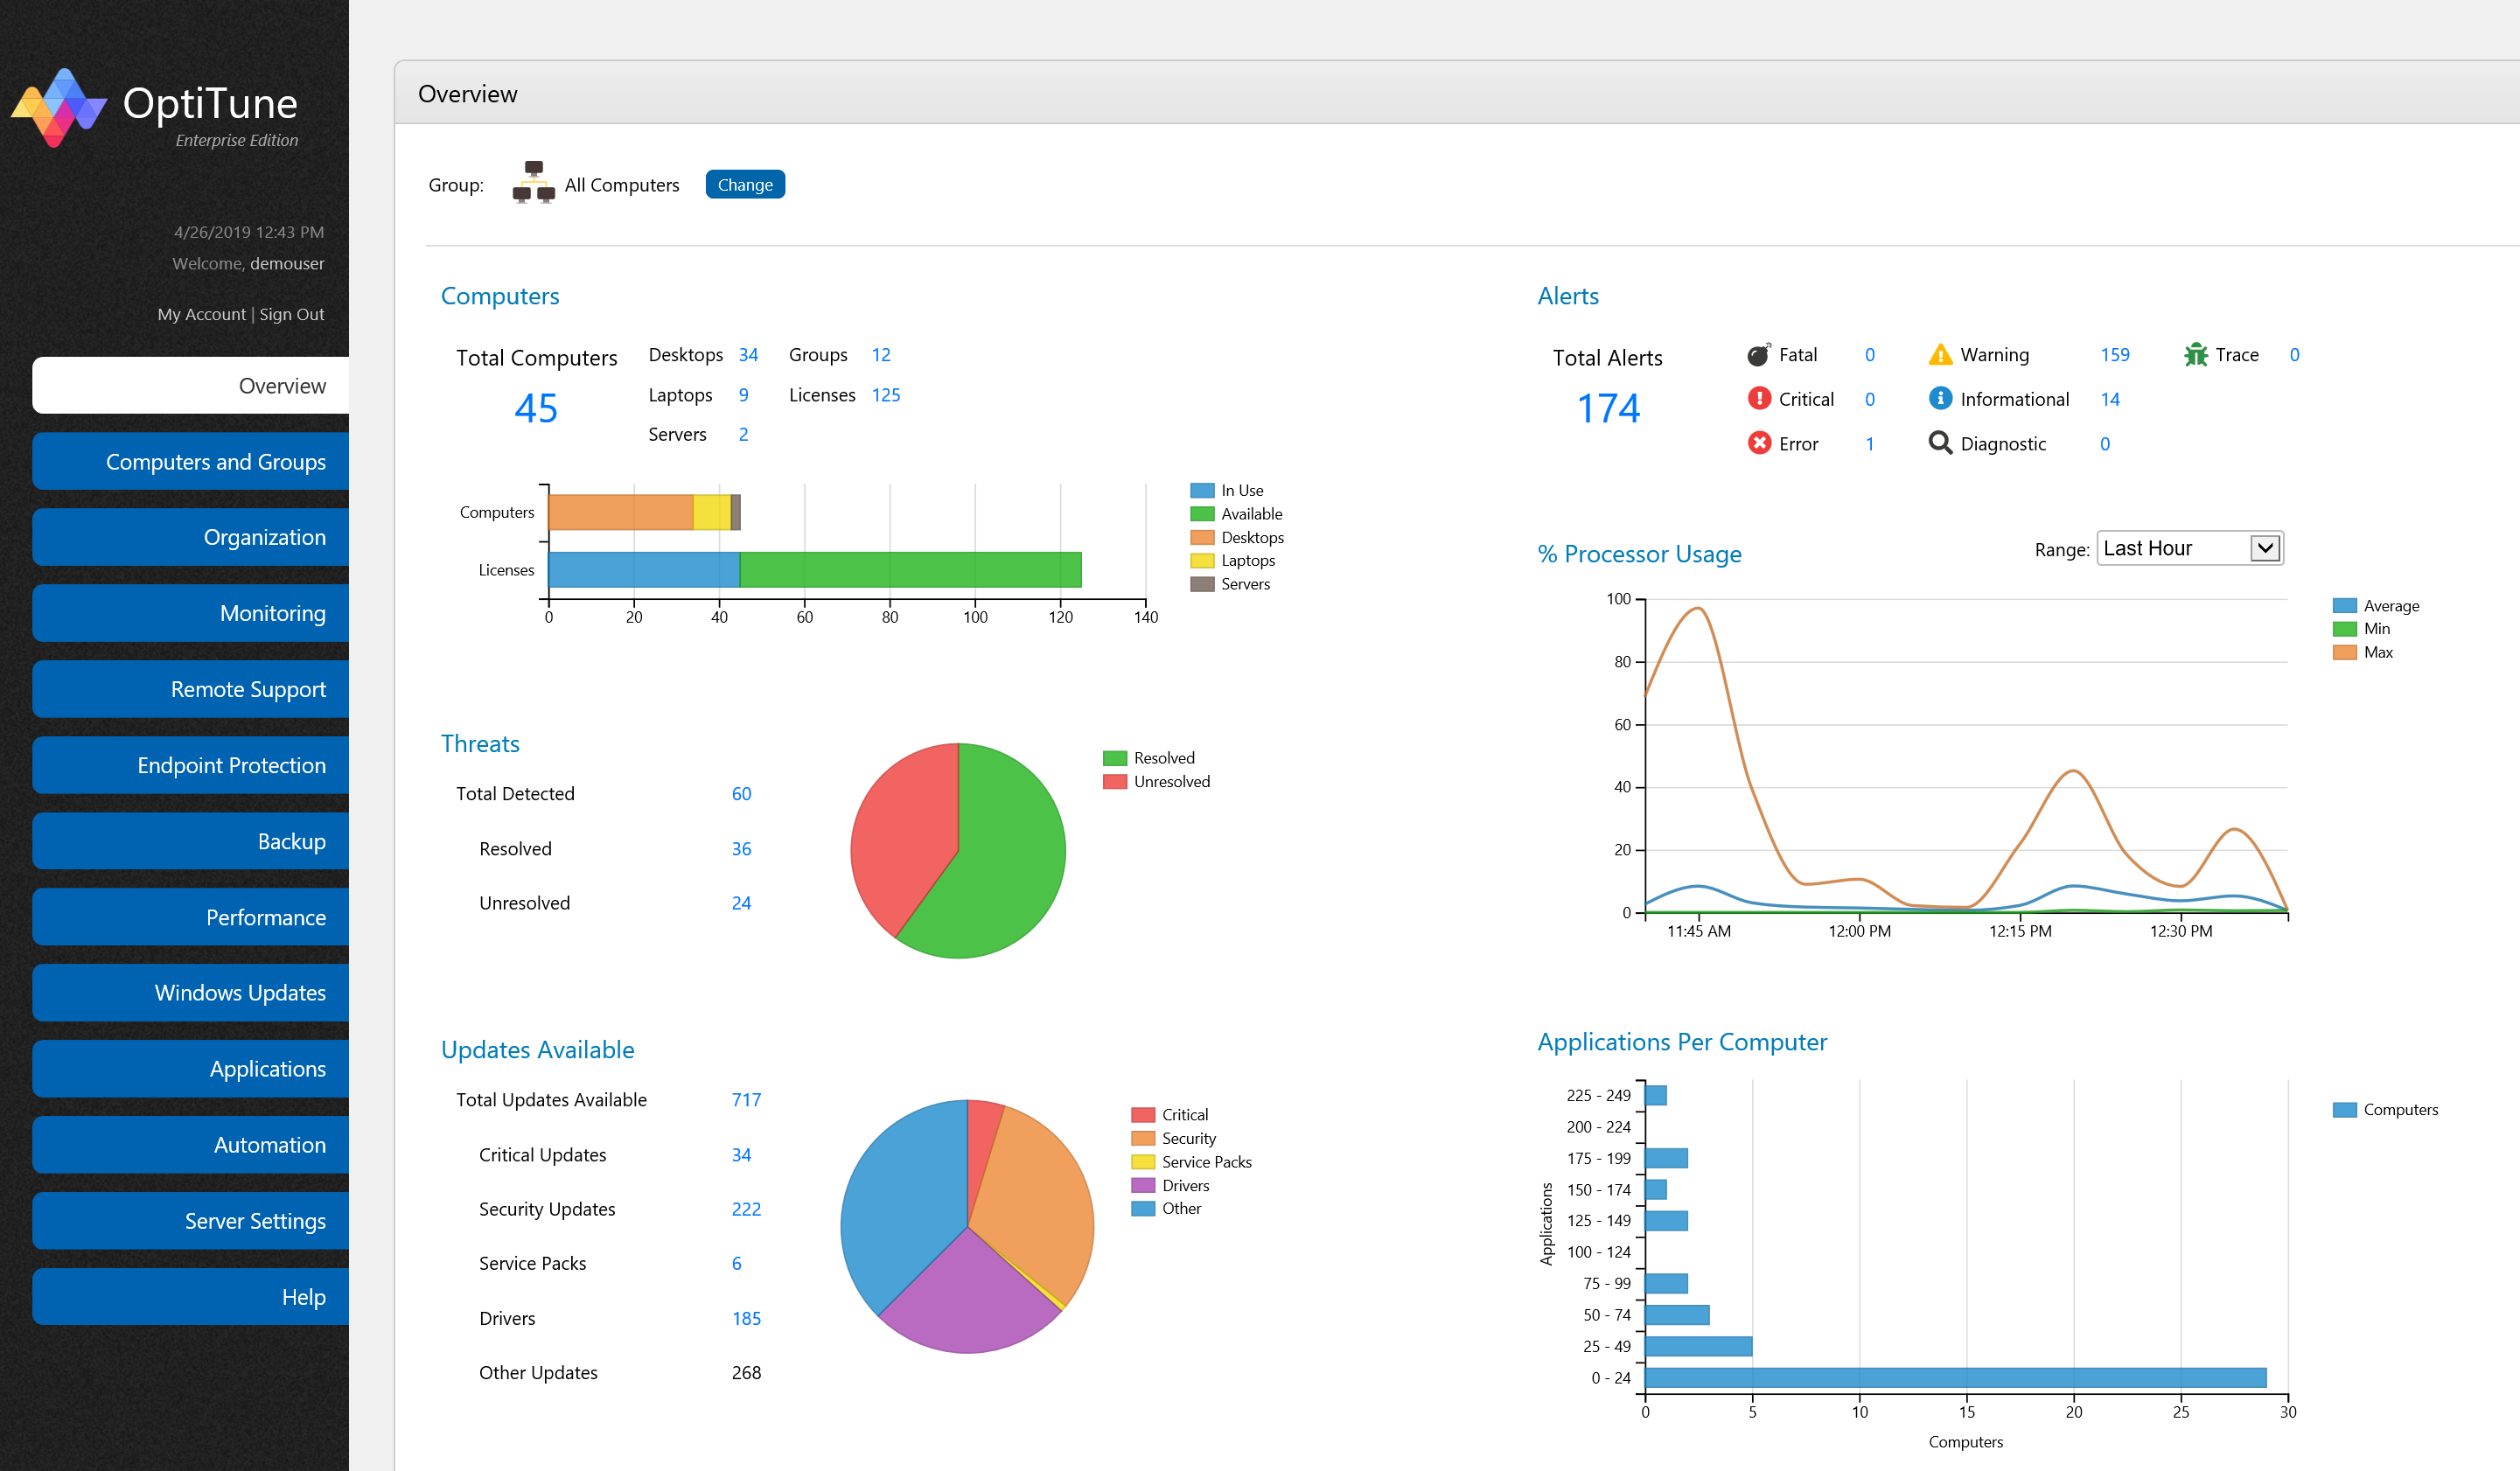
On this screen, you will find several charts showing high level status on selected areas of computer management. You can change the computer or group selected by clicking on the "Change" button at the top of the screen.
You can also click on any numbers in blue to view more details.
Computers
This chart shows a breakdown of the selected group of computers (or single computer, if a computer is selected above).
It shows the following categories of computers:
Desktops - the number desktop computers
Laptops - the number of laptop or portable computers
Servers - the number of server computers (based on their operating system).
If the "All Computers" group is selected, it will also show the current license usage. Blue represents licenses in use, green represents available licenses, and red represents licenses which you need to purchase.
Threats
This chart shows a breakdown of the threats detected for the selected group of computers (or single computer, if a computer is selected above).
It shows the total number of threats detected, which is broken down to threats resolved, and threats unresolved. The number of unresolved threats may be worth further examination, since it indicates the antivirus software was unable to resolve the threats on its own.
Updates Available
This chart shows a breakdown of the updates available for the selected group of computers (or single computer, if a computer is selected above).
It shows the following categories of updates available:
Critical Updates - the number of updates that Microsoft has deemed critical, requiring immediate attention
Security Updates - the number of updates that fix security issues
Service Packs - the number of service packs available to install, each of which will include several updates
Drivers - the number of driver packages that can be installed for hardware detected on the computer
Other Updates - all other types of updates
% Processor Usage
This chart shows the min, max, and average processor usage for the selected group of computers. If a single computer is selected, it shows the actual processor usage. Keep in mind that gathering performance information is not turned on by default, and to gather this data, it must be turned on in the Performance Settings page.
Applications Per Computer
This chart shows the distribution of applications per computer. On the Y axis are the ranges of installed applications, and on the X axis are the number of computers who have installed applications in each range.
Current Deployments
This chart shows the following breakdown of the current deployments for the selected computer or group:
Succeeded - the total number of computer deployments that have succeeded
Failed - the total number of computer deployments that have failed
No Report - the total number of computer deployments where OptiTune has not yet received a report
It only shows deployments that are targeted specifically to the selected computer or group.