Automation Overview
To view the automation overview, click on the "Automation" tab, then select "Overview".
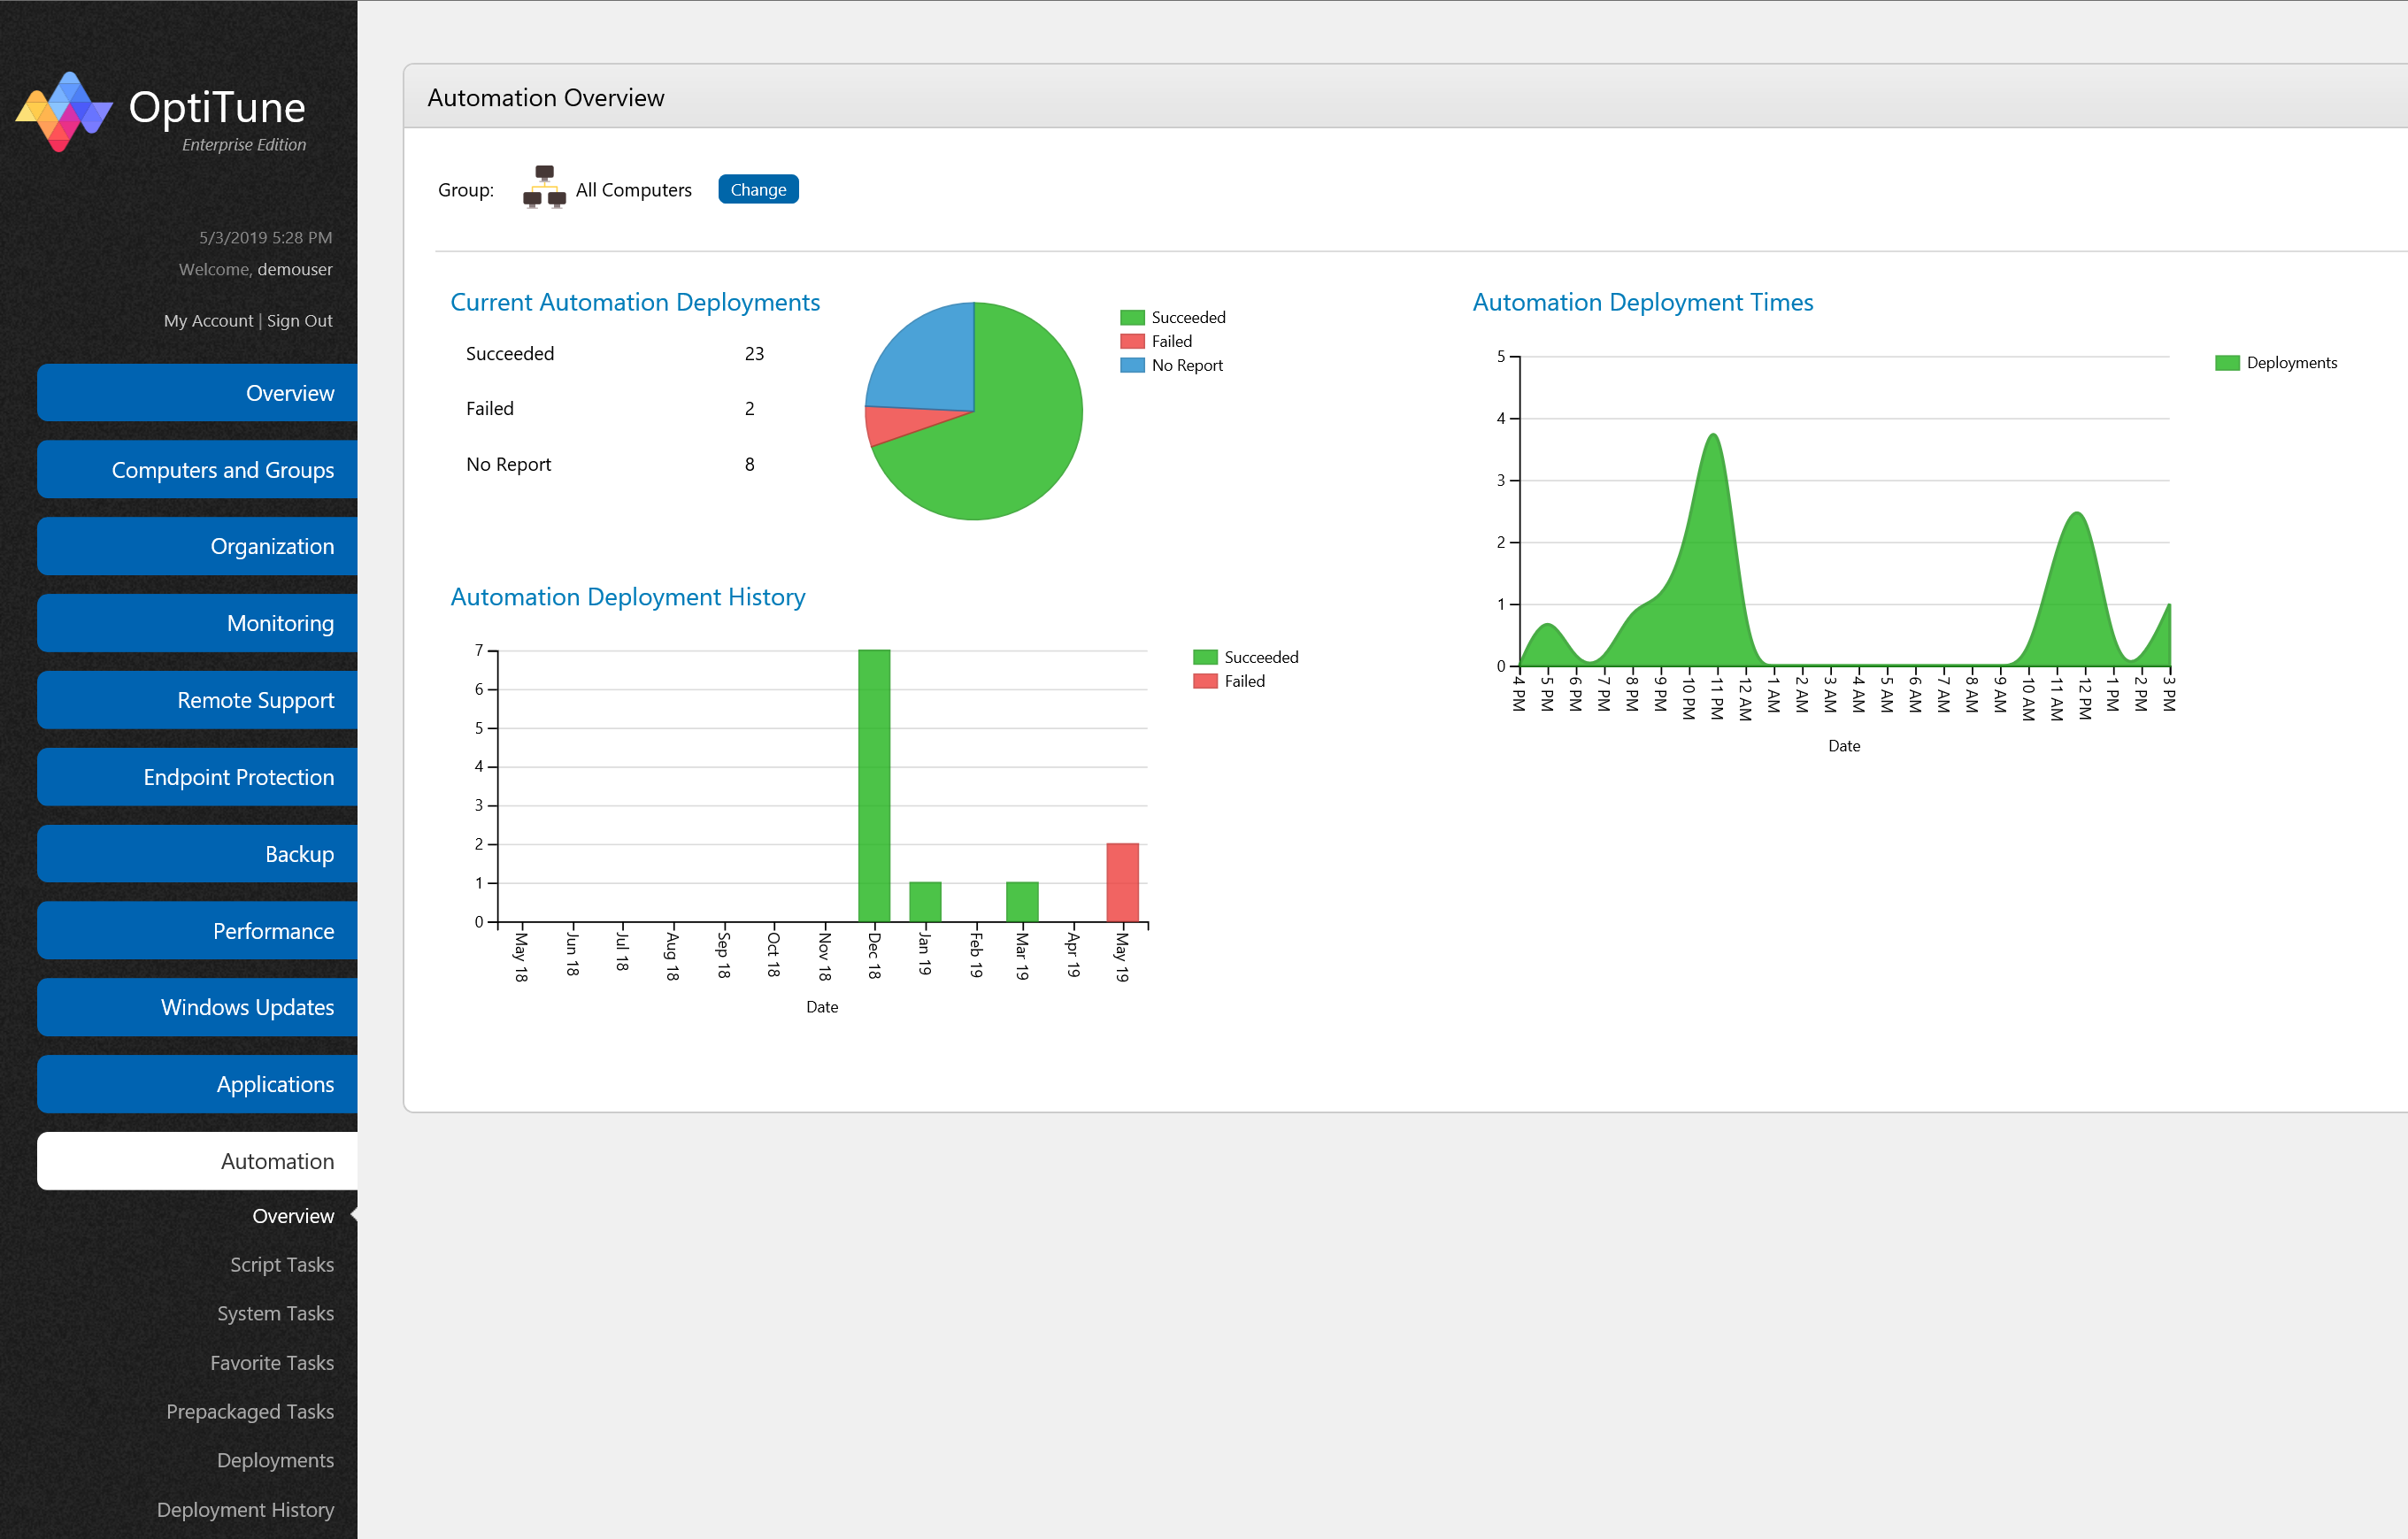
On this screen, you will find several charts showing high level status about scripts and other task deployments. You can change the computer or group selected by clicking on the "Change" button at the top of the screen.
Current Automation Deployments
This chart shows the following breakdown of the current deployments for the selected computer or group:
Succeeded - the total number of computer deployments that have succeeded
Failed - the total number of computer deployments that have failed
No Report - the total number of computer deployments where OptiTune has not yet received a report
It only shows deployments that are targeted specifically to the selected computer or group.
Automation Deployment History
This chart shows the deployment history by month, for the group of computers (or single computer) selected.
The areas in green represent deployments which have succeeded, and the areas in red represent deployments which have failed.
Automation Deployment Times
This chart shows the times of day (in the logged in user's time zone) when deployments were attempted for the selected computer or group.