Applications Overview
To view the applications overview, click on the "Applications" tab, then select "Overview".
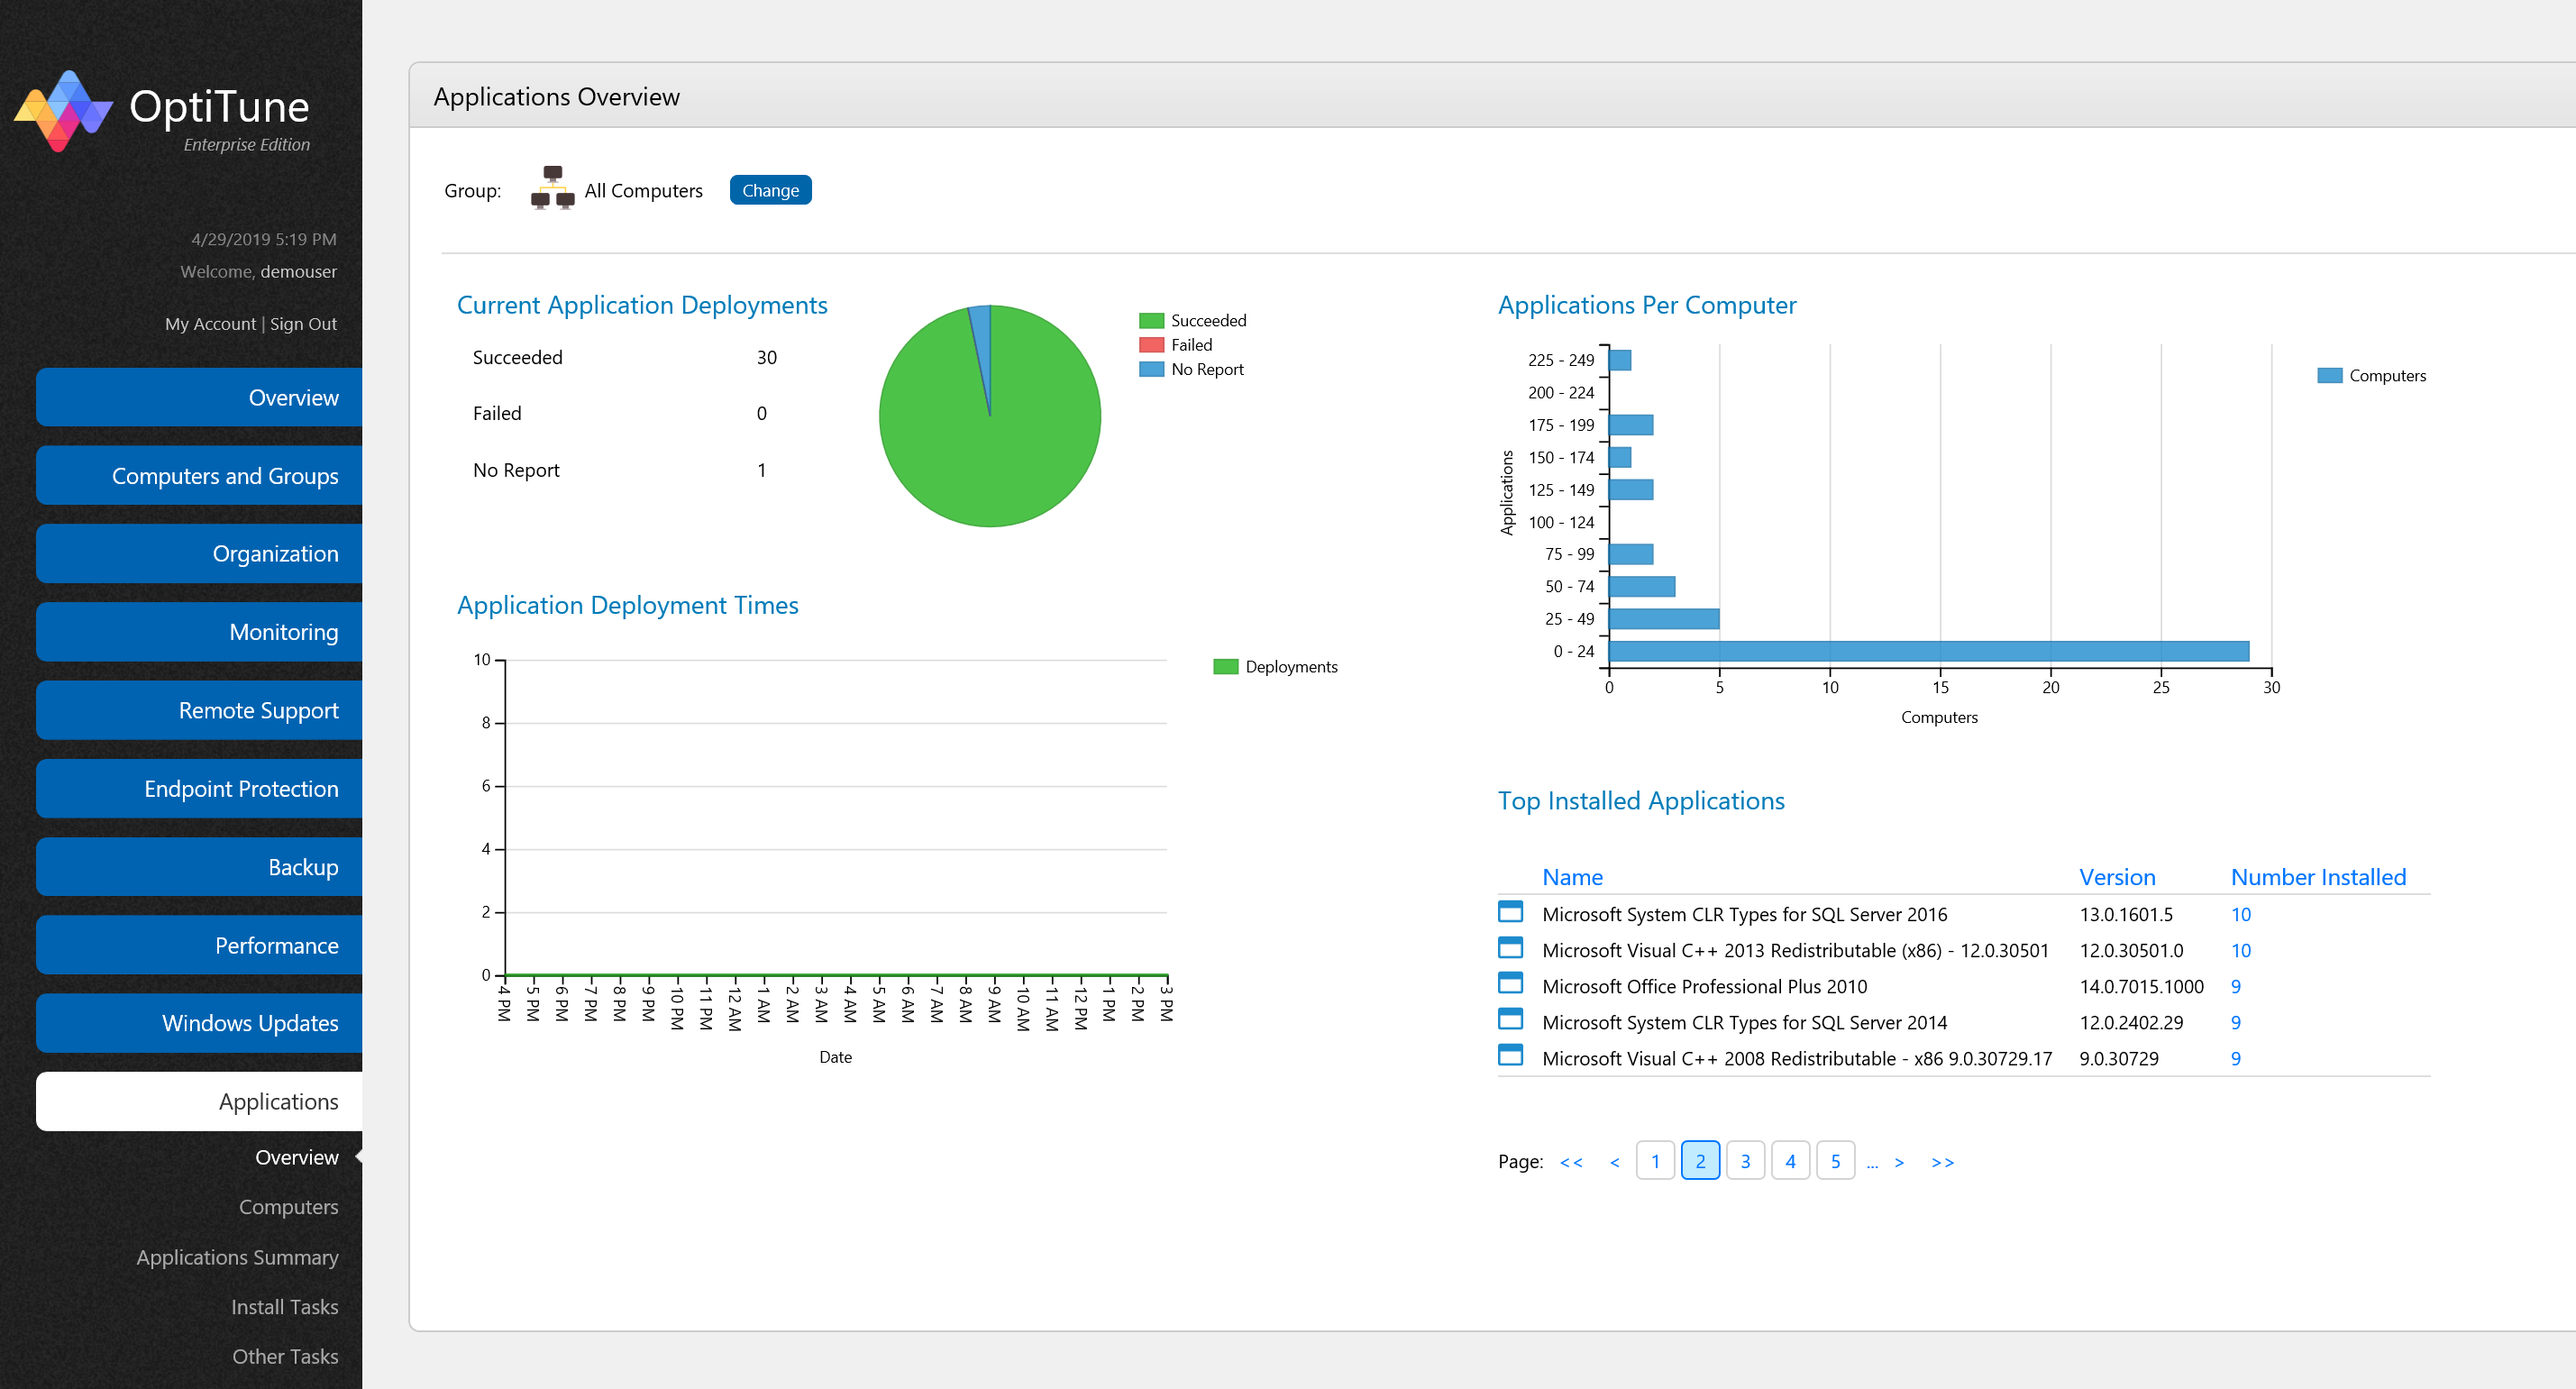
On this screen, you will find several charts showing high level status about applications and application deployments. You can change the computer or group selected by clicking on the "Change" button at the top of the screen.
You can also click on any numbers in blue to view more details.
On the left side of the screen are charts about application deployments (i.e. deploying applications to computers in your organization). On the right side of the screen are charts about applications which are already installed.
Current Application Deployments
This chart shows the following breakdown of the current deployments for the selected computer or group:
Succeeded - the total number of computer deployments that have succeeded
Failed - the total number of computer deployments that have failed
No Report - the total number of computer deployments where OptiTune has not yet received a report
It only shows deployments that are targeted specifically to the selected computer or group.
Application Deployment History
This chart shows the deployment history by month, for the group of computers (or single computer) selected.
The areas in green represent deployments which have succeeded, and the areas in red represent deployments which have failed.
Application Deployment Times
This chart shows the times of day (in the logged in user's time zone) when deployments were attempted for the selected computer or group.
Applications Per Computer
This chart shows the distribution of applications per computer. On the Y axis are the ranges of installed applications, and on the X axis are the number of computers who have installed applications in each range.
Top Installed Applications
This listing shows the top installed applications for the selected computer or group. You can sort the columns by clicking on the column headers, or page through the list.